Understanding Histograms in Photography:
Histograms display a graphic representation of the exposure on a captured image. They provide highly accurate information, but their use is often ignored.
How Histogram work?
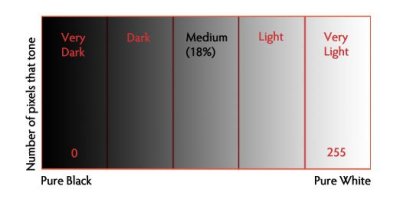 Histograms are a graph showing brightness levels of pixels in a recorded image. The camera’s processor arranges each Pixel recorded in sensor, on a horizontal scale on the histogram, according to its relative brightness from 0 ie pure black to 255 ie pure white.
Bright pixels are located on the right Side of the graph and darker pixels on the left side of the graph. Brightest pixels which are reproduce pure white and darkest pixels which are reproduce pure black with no detail, would be at the extreme right / left edges of a histogram. The height of the graph within a histogram Shows how many pixels in a scene were recorded at a given exposure level.
How to read a histogram :
Histograms Shows the brightness information from a specific image, but there are no “good” or “bad” histograms. Different subjects can generate completely different histograms, but both are properly exposed.
For example, a white Subject on a white background, if properly exposed, will generate a histogram to the right side, because there are no or very few shadows and mid-tones. In this example, all the pixels in the image will show a high brightness level in a properly exposed image.
a black Subject on a black background will display a histogram to the left, which normally would be a sign of under exposure, but in this case, in the actual scene, there are few mid-tones and no highlights. In this example, all the pixels in the image will show low shadow level in a properly exposed image.
So, the photographer needs to think of the subject and scene, if the subject is white against a white background, and a histogram shows lots of pixels in the middle of the image, it is a clear sign to the photographer that this particular image is under-exposed.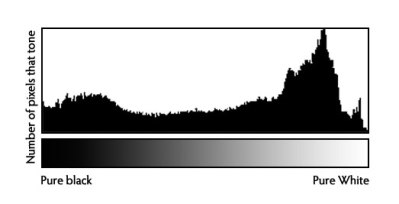
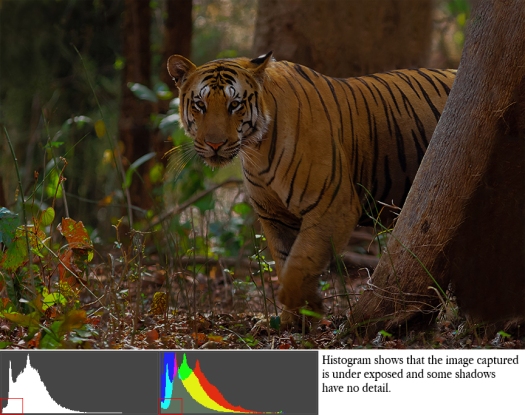
One of the easiest ways to quickly use a histogram is to look at its graphic values, and simply ask if any of the bright areas on the right side, or dark areas on the left side, are touching edges of the histogram and the extreme left or right graph line extend vertically. Either condition indicates SOME area of the scene is reproducing as an over-exposed white, or an under-exposed black tone.
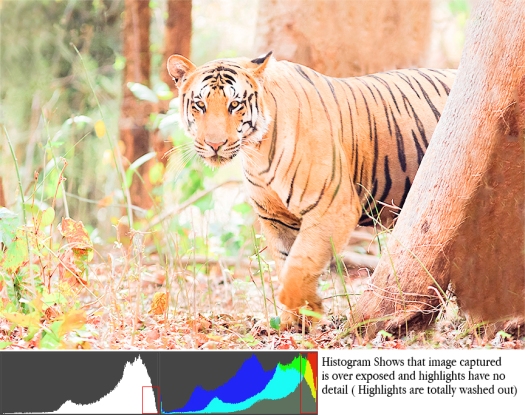
Now, it’s again up to the photographer to think for a moment. If the scene is a snow-covered field or a Person in a white dress in bright background, and the bulk of the histogram is pushed against the right edge of the graph and cut off along the right, it’s a clear indication that the image is over-exposed, and that another picture should be taken with reduced exposure.
But, it is possible to have a properly exposed scene with bright objects, such as the sun in the frame, which do appear as over-exposed areas. If these are the only areas in the scene that are washed out and the histogram is telling you that the image is over exposed but the exposure is actually correct. So don’t immediately think that there is a problem if part of the histogram is cut-off along the left or right side, until you have thought about the scene and subjects within it.
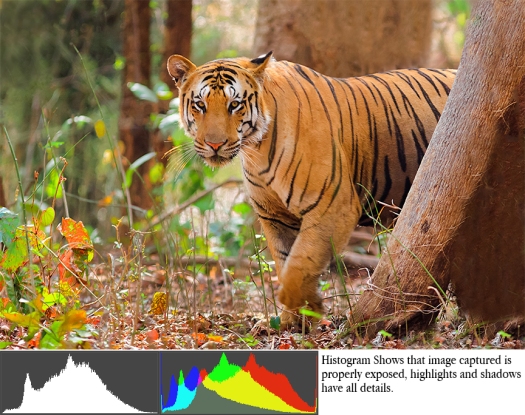
A histogram is a great tool for judging whether the brightness range of a scene will fit within the dynamic range of the camera. If the exposure graph fits within the histogram’s left and right margins, it means we have an easily workable and printable image. If the histogram is pushed up against either side, it means some parts of the image will be too light or too dark to reproduce with detail.
A “good” histogram doesn’t have to stretch entirely from the left to right side to indicate proper overall exposure. But if its peaks, large and small, all fit within the left/right borders, it is telling you that nothing in the scene will reproduce as a washed out white, or a black with zero detail.
Colour RGB Histogram :
Conventional histograms measure only brightness, as recorded in an image file. But, it is possible to view histograms that not only show overall brightness, but the brightness of each color channel. Most cameras offer the choice to display a brightness histogram or a colour RGB histogram.
For most users, the Brightness histogram is sufficient to evaluate exposure when reviewing images. But, there are situations where it can be useful to view a graph of all three color channels. The RGB histogram can inform a user when there is a color shift , which is useful when trying to white balance a known neutral colored test subject. It can also be helpful for determining whether any single color channel is at risk of being appear too light or too dark.
Highlight alert display:
Most SLR cameras have a setting called “highlight alert”. It will make any overexposed highlights blink when you preview your images on your camera screen. For how to activate this function on your camera please refer your camera manual.
Remember, RAW files will always offer more room to correct exposure and other problems. Correcting improper exposures during image editing in the computer has limitations and often results in a loss of image quality. Histograms give the photographer a tool to evaluate and perform corrections immediately after an image is taken, which means that less time is later spent at the computer trying to optimize images.